In today’s data-driven world, businesses and organizations rely on data analytics to make smarter decisions, improve operations, and gain competitive advantages. But what exactly is data analytics, and how can someone new to the field get started?
This guide breaks down the core concepts, types of data analytics, key tools, and essential skills for anyone interested in entering this exciting domain.
🔍 What Is Data Analytics?
Data analytics refers to the process of examining datasets to uncover patterns, draw conclusions, and support decision-making. It transforms raw data into actionable insights through various methods, tools, and technologies.
At its core, data analytics involves:
- Collecting data from multiple sources
- Cleaning and organizing the data
- Analyzing the data to identify trends, relationships, and anomalies
- Visualizing and communicating the findings to stakeholders
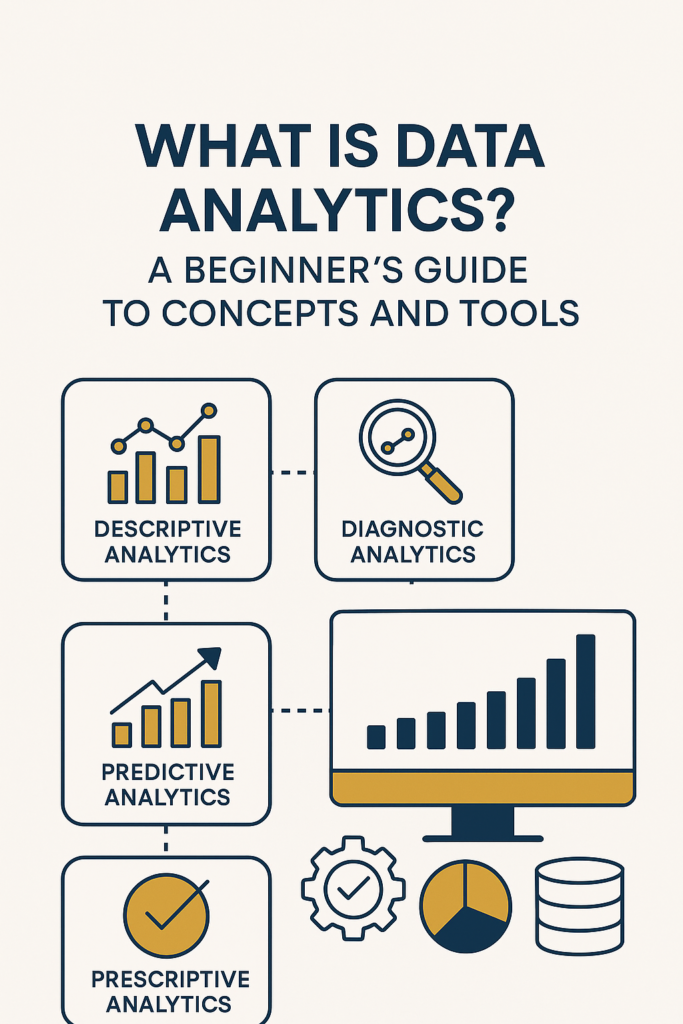
📊 Types of Data Analytics
Data analytics is generally categorized into four main types:
1. Descriptive Analytics
What happened?
This involves summarizing historical data to understand past behavior. Dashboards and reports are common tools here.
Example: Monthly sales reports, website traffic summaries.
2. Diagnostic Analytics
Why did it happen?
This digs deeper to identify root causes behind trends and anomalies.
Example: Analyzing why product returns spiked in a particular region.
3. Predictive Analytics
What is likely to happen?
Uses statistical models and machine learning algorithms to forecast future outcomes.
Example: Predicting customer churn or future sales.
4. Prescriptive Analytics
What should we do about it?
Recommends actions based on predicted outcomes. This often involves optimization and simulation.
Example: Recommending marketing strategies based on predicted customer behavior.
🛠️ Tools Used in Data Analytics
Whether you’re analyzing sales figures or building machine learning models, the right tools are critical. Here are some commonly used ones:
Data Manipulation & Analysis
- Excel – Great for small-scale analysis and quick insights.
- SQL – Essential for querying databases and extracting structured data.
- Python (with libraries like
pandas,NumPy) – Powerful for large-scale data processing and automation. - R – Popular for statistical analysis and data visualization.
Data Visualization
- Tableau – A leading BI tool for creating interactive dashboards.
- Power BI – Microsoft’s visualization platform, great for enterprise environments.
- Matplotlib / Seaborn (Python) – Programmatic visualization for reports and automation.
Data Storage & Warehousing
- MySQL / PostgreSQL – Relational databases for structured data.
- BigQuery / Snowflake – Cloud-based data warehouses for large-scale analytics.
Machine Learning & Predictive Modeling
- scikit-learn – A robust Python library for ML algorithms.
- TensorFlow / PyTorch – For deep learning and neural networks.
📚 Key Concepts to Understand
Before diving into tools, familiarize yourself with foundational concepts:
- Data Types – Numerical, categorical, time-series, etc.
- Data Cleaning – Handling missing values, duplicates, outliers.
- Statistical Measures – Mean, median, variance, correlation.
- Data Sampling – Ensuring data represents the larger population.
- ETL (Extract, Transform, Load) – Moving and transforming data between systems.
🚀 How to Get Started
1. Learn the Basics
Start with Excel and SQL to understand how to manipulate data and derive insights. Free courses on platforms like Coursera, edX, and YouTube can help.
2. Practice on Real Data
Use public datasets from sources like Kaggle, Data.gov, or UCI Machine Learning Repository to build your skills.
3. Learn Python or R
Pick one programming language to start automating your analyses and working on larger datasets.
4. Build Projects
Try solving real-world problems—like analyzing COVID-19 data or building a sales forecast model—to strengthen your portfolio.
5. Understand the Business
Analytics is not just technical. Knowing the domain (finance, healthcare, marketing, etc.) adds tremendous value.
🧠 Final Thoughts
Data analytics is more than just number-crunching—it’s a strategic asset for organizations and a powerful skill for professionals. Whether you’re aspiring to be a data analyst, data scientist, or just want to make data-driven decisions, understanding the concepts and tools behind data analytics is your first step.
With curiosity, practice, and the right tools, anyone can master the art of turning data into insight.