Data analysis is one of the most essential skills in today’s data-driven world. Whether you’re a business analyst, researcher, or data enthusiast, drawing the right conclusions from data can drive better decisions and reveal meaningful insights. However, for beginners, it’s easy to fall into common pitfalls that can mislead analysis or compromise the validity of your results.
Here are five frequent data analysis mistakes beginners should watch out for—and how to avoid them.
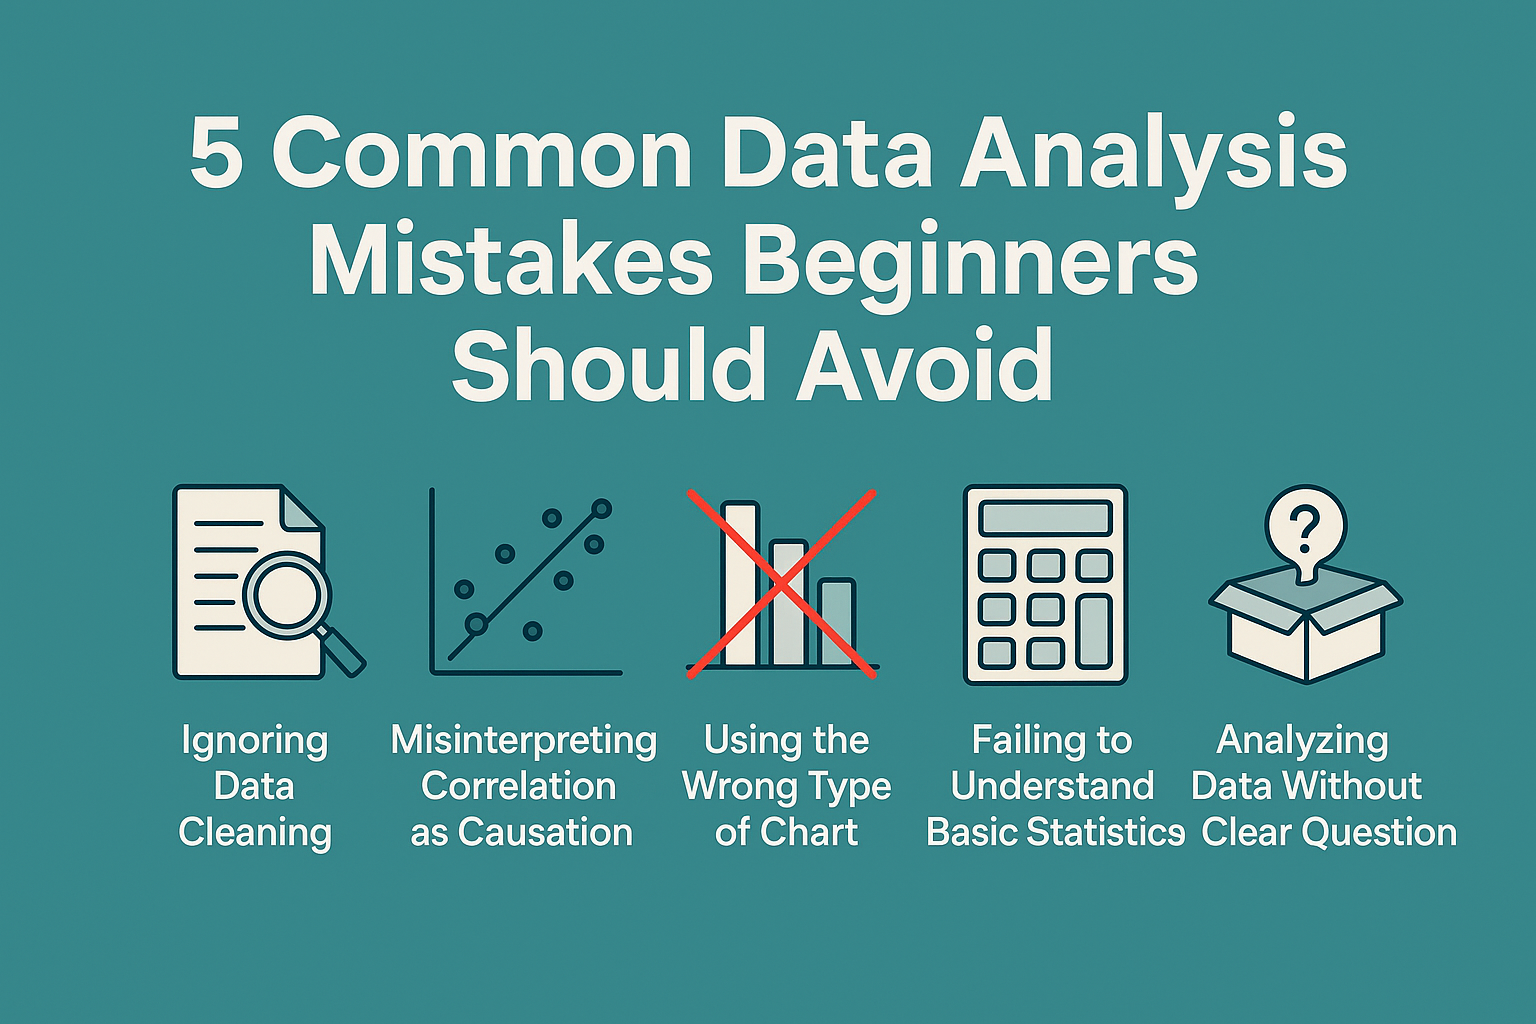
1. 📉 Ignoring Data Cleaning
The Mistake: Jumping straight into analysis without cleaning the data.
Why It Matters: Raw data often contains missing values, duplicates, typos, and inconsistent formatting. Ignoring these issues can lead to skewed statistics and incorrect visualizations.
Avoid It:
- Use
.isnull()to check for missing data in pandas. - Remove or impute null values based on context.
- Standardize units and formats (e.g., dates, currency, text casing).
- Remove or consolidate duplicate entries.
Tip: Treat data cleaning as at least 50% of your project. Better input = better insights.
2. 📊 Misinterpreting Correlation as Causation
The Mistake: Assuming that because two variables move together, one causes the other.
Why It Matters: Correlation does not imply causation. For example, ice cream sales and drowning deaths both rise in summer, but one doesn’t cause the other.
Avoid It:
- Use statistical methods like regression analysis or Granger causality to explore causal relationships.
- Always ask: Could there be a third factor influencing both variables?
Tip: Consider visualizing correlations but reserve causal claims for well-controlled studies or experiments.
3. ⚖️ Using the Wrong Type of Chart
The Mistake: Presenting data with an inappropriate or misleading chart type.
Why It Matters: The wrong chart can obscure trends or misrepresent proportions, confusing your audience or leading to misinterpretation.
Avoid It:
- Use bar charts for comparisons.
- Use line charts for trends over time.
- Use scatter plots for relationships and correlation.
- Avoid 3D charts—they’re flashy but hard to read.
Tip: Always match the chart to the message you want to convey.
4. 🧮 Failing to Understand Basic Statistics
The Mistake: Using statistical terms or tests without fully understanding them.
Why It Matters: Misusing statistical methods like p-values, averages, or standard deviation can lead to incorrect conclusions.
Avoid It:
- Learn the basics: mean, median, mode, variance, standard deviation, confidence intervals.
- Know when to use t-tests, chi-square tests, or ANOVA.
- Understand what a p-value tells you—and what it doesn’t.
Tip: Don’t blindly trust statistical outputs. Interpret them with context and critical thinking.
5. 📦 Analyzing Data Without a Clear Question
The Mistake: Diving into data exploration without a hypothesis or defined objective.
Why It Matters: Without a goal, analysis becomes a fishing expedition. You may find interesting patterns—but not actionable insights.
Avoid It:
- Start every analysis with a well-defined question or hypothesis.
- Align your metrics and visualizations with that question.
- Validate findings against the original problem you’re trying to solve.
Tip: Ask: “What decision will this analysis support?”
🧠 Final Thoughts
Data analysis is as much about thinking critically as it is about writing code or generating charts. By avoiding these five beginner mistakes, you’ll ensure your analyses are not only technically correct but also meaningful and actionable.
Want to get better at data analysis? Start small, practice often, and don’t be afraid to ask questions. Mistakes are part of the learning process—just make sure you learn from them.