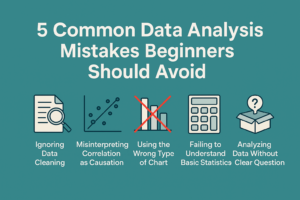
Whether you’re running A/B tests, analyzing clinical trial results, or evaluating machine learning outputs, p-values and statistical significance are concepts you’ll encounter often. Unfortunately, they’re also widely misunderstood.
This guide will demystify what a p-value actually means, how to interpret statistical significance, and when to be cautious about drawing conclusions.
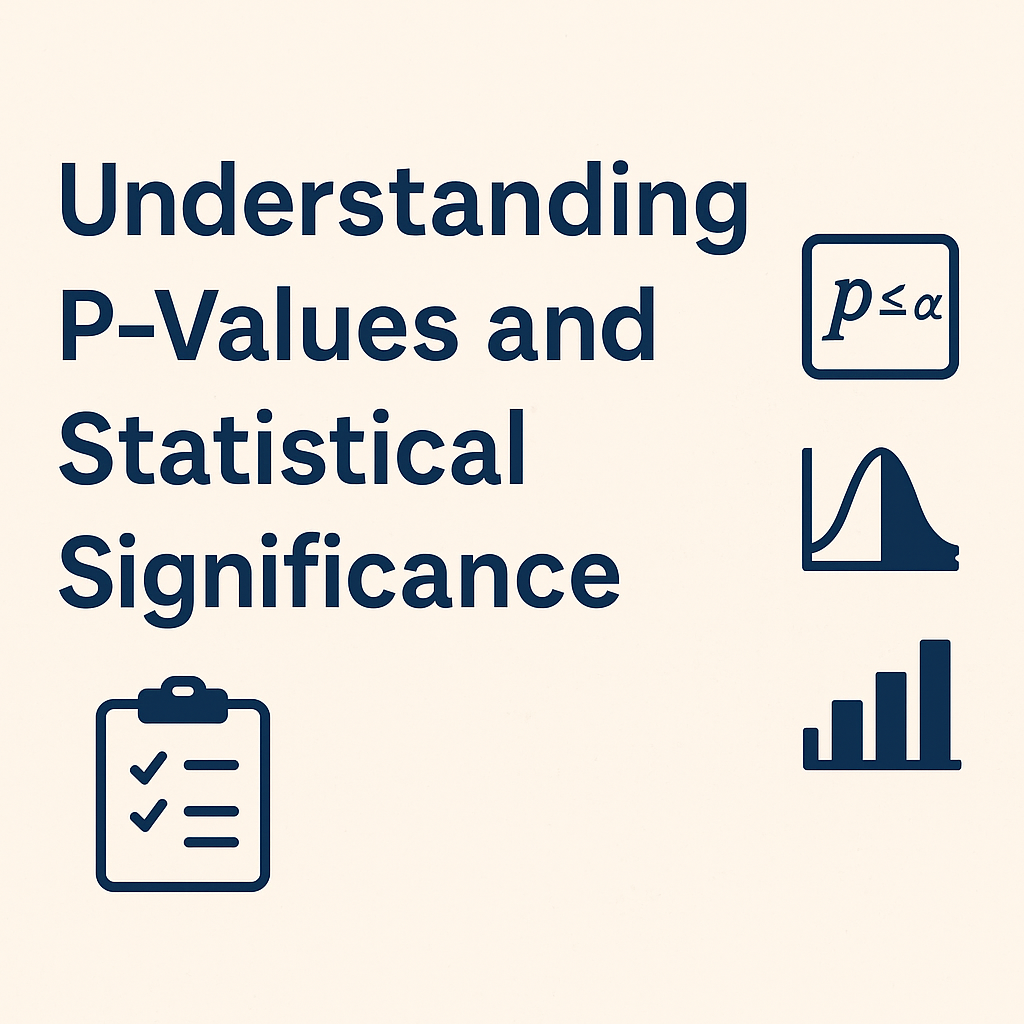
🔍 What Is a P-Value?
A p-value is the probability of observing results as extreme as the ones you have, assuming the null hypothesis is true.
In simpler terms: It tells you how likely your data would be if there was no real effect.
Example:
Imagine testing a new marketing email. You want to know if the new version performs better than the current one.
- Null hypothesis (H₀): There’s no difference in performance.
- Alternative hypothesis (H₁): The new email performs better.
If your p-value is 0.03, it means there’s a 3% chance you’d see your observed difference if there was actually no difference.
✅ Interpreting Statistical Significance
To decide if your results are statistically significant, you compare your p-value to a significance level, commonly denoted as alpha (α).
- A common threshold is α = 0.05 (5%).
- If p ≤ α, you reject the null hypothesis → the result is statistically significant.
- If p > α, you fail to reject the null → not significant.
Important:
Statistical significance ≠ practical importance.
A tiny effect can be statistically significant if your sample is large enough.
⚠️ Common Misconceptions About P-Values
❌ “A low p-value means the result is true.”
No—it means the result is unlikely if the null hypothesis were true. It doesn’t “prove” the alternative hypothesis.
❌ “A high p-value proves there is no effect.”
Not quite—it just means you don’t have enough evidence to reject the null hypothesis.
❌ “p = 0.05 means a 5% chance the result is random.”
No—it means that there’s a 5% chance you’d get a result as extreme as yours under the assumption that nothing real is happening.
📦 Practical Tips for Using P-Values
1. Always define your hypotheses clearly.
Make sure your null and alternative hypotheses are meaningful and testable.
2. Use confidence intervals alongside p-values.
They provide information about the range of likely effects, not just significance.
3. Avoid p-hacking.
Don’t manipulate your analysis (e.g., changing groups, filtering data) just to get a significant p-value.
4. Don’t rely on p-values alone.
Combine them with domain knowledge, effect size, and exploratory data analysis.
🧠 Summary
| Term | Meaning |
|---|---|
| P-value | Probability of your result given the null hypothesis is true |
| Null hypothesis | Assumes no effect or difference |
| α (alpha) | Significance threshold (commonly 0.05) |
| Statistical significance | When p ≤ α, the result is considered statistically significant |
🧪 Bonus: When Should You Worry About Significance?
- Low p-value + large effect = likely a meaningful discovery
- Low p-value + tiny effect = possibly real, but maybe not useful
- High p-value + small sample size = inconclusive; collect more data
- High p-value + large sample size = likely no meaningful effect
📚 Further Reading
- “The Cult of Statistical Significance” – Stephen T. Ziliak & Deirdre N. McCloskey
- “Understanding Confidence Intervals” – Coming soon on this blog
- Interactive visualization of p-values (external tool)
Thanks for reading! Have a question about p-values or want a follow-up post on confidence intervals or hypothesis testing frameworks (like Bayesian vs Frequentist)? Drop a comment or reach out!